Nine Production Automations Have 31 Endings. Fewer Than Half Are the Happy Path
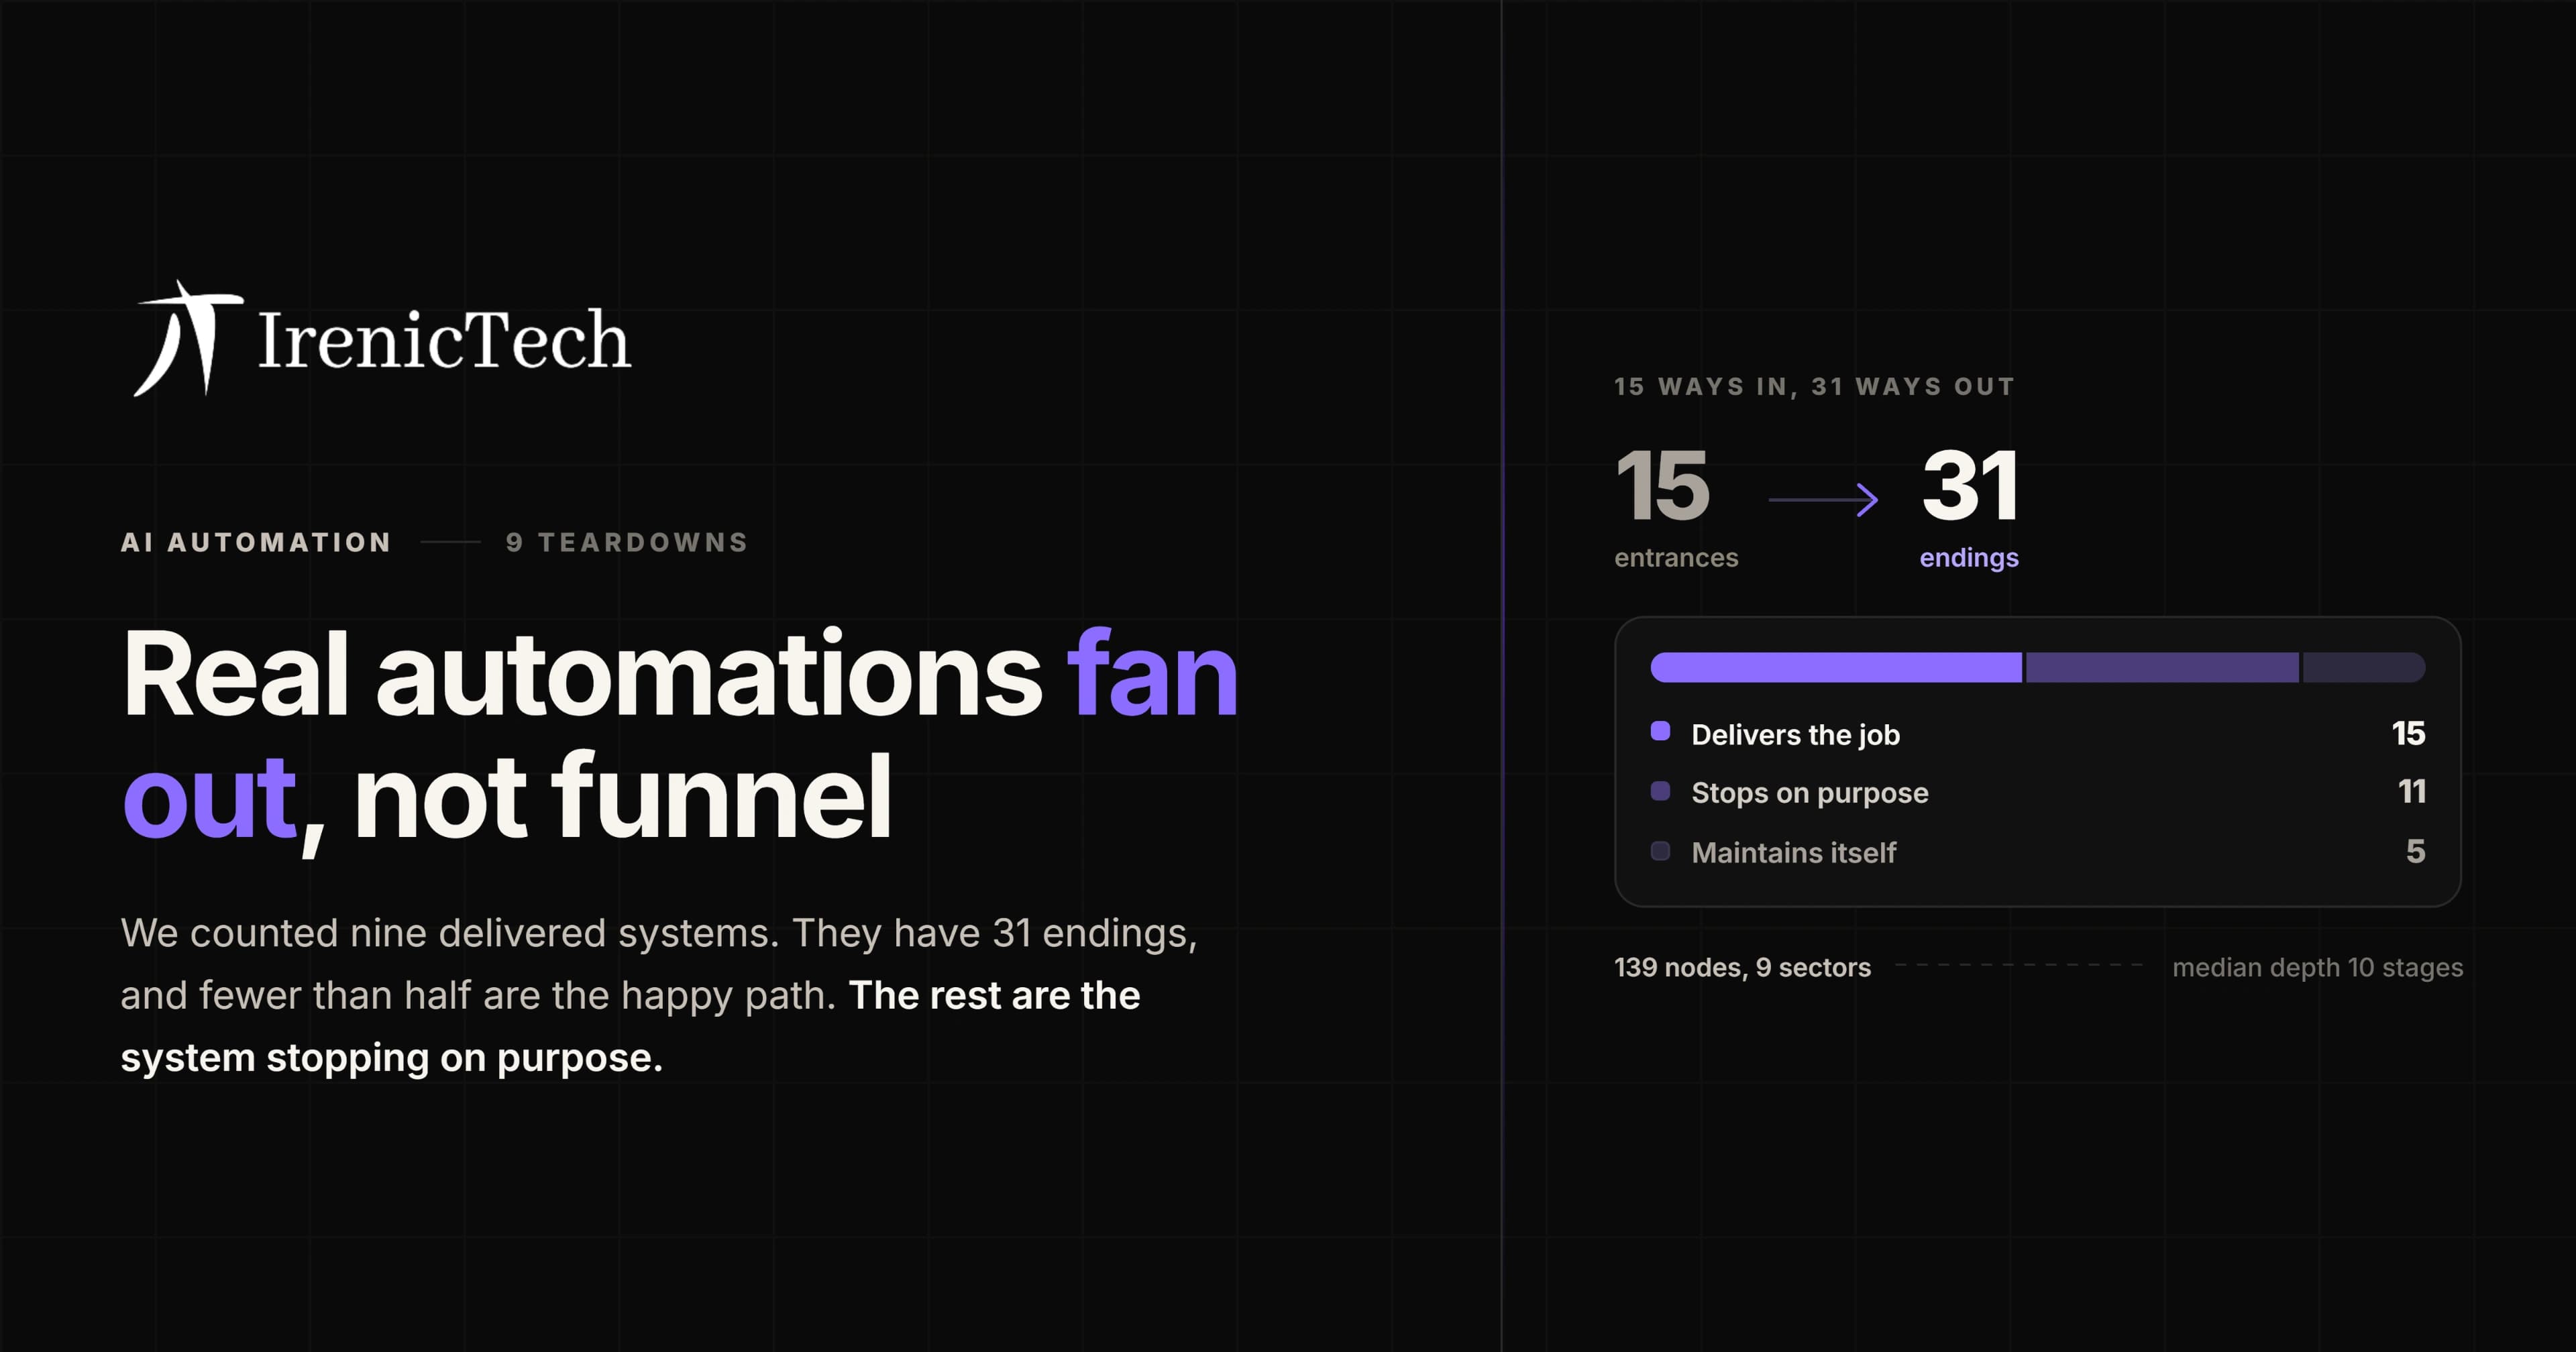
Almost nobody publishes the architecture of the automations they deliver, so almost nobody can say what one actually looks like. We publish nine, which means we can count them. Across 139 nodes and 148 edges in nine sectors, the systems fan out rather than funnel: 15 ways in against 31 ways out. And of those 31 endings, only 15 are the thing the system was built to do. The rest are refusals, holds, escalations and self-maintenance.
IrenicTech · · 7 min read
Almost nobody publishes the architecture of the automations they deliver. The usual reason is that the decision logic feels like the thing you are being paid for, so giving it away seems foolish.
The consequence is that there is very little public evidence about what a production automation actually looks like. Plenty of templates, plenty of demos, almost no anatomy.
We publish ours. Nine delivered systems are on this site as full teardowns: every intake channel, every branch, and the condition that fires it, transcribed from the delivered workflow rather than simplified for presentation. Which means we can do something unusual, and something anybody can repeat: count them.
The corpus
Nine systems, in nine different sectors, containing 139 nodes and 148 edges between them.
| System | Sector | Stages | Nodes | In | Out |
|---|---|---|---|---|---|
| Healthcare appointments | Healthcare | 11 | 18 | 3 | 3 |
| Release content orchestration | Software product | 11 | 21 | 1 | 5 |
| Voice compliance line | Regulatory compliance | 7 | 14 | 3 | 4 |
| Multi-tenant WhatsApp | Education | 10 | 15 | 1 | 4 |
| Legal case video | Legal | 9 | 14 | 2 | 4 |
| B2B lead pipeline | B2B sales | 10 | 12 | 1 | 1 |
| Claims tracking CRM | Pharmacy | 6 | 8 | 1 | 3 |
| Construction bid handover | Construction | 12 | 19 | 1 | 3 |
| Competitor ad pipeline | Ecommerce | 12 | 18 | 2 | 4 |
Every figure below is computed from those nine graphs. If you think a count is wrong, the data is one click away and you can recount it.
They fan out, they do not funnel
The mental model almost everyone brings to automation is a funnel. Several things come in at the top, the system processes them, one clean output comes out of the bottom.
The corpus says the opposite.
15 ways in. 31 ways out. Roughly two exits for every entrance, and seven of the nine systems have more endings than beginnings.
The one system that does not fan out, the B2B lead pipeline with a single entrance and a single exit, is the exception that makes the point: it is a narrow pipeline whose whole job is to get one kind of record into one destination without creating a duplicate. Everything that handles real-world input branches.
This is not an aesthetic observation. It is a scoping one. A specification that describes what happens when things go well is describing roughly one exit out of three.
Fewer than half the endings are the happy path
This is the finding I did not expect, and it is the one worth taking away.
We classified all 31 endings by what they actually represent:
| What the ending is | Count | Share |
|---|---|---|
| Delivered the thing it was built for | 15 | 48% |
| Stopped short, deliberately | 11 | 35% |
| Maintained itself | 5 | 16% |
More than half of what these systems do is not the thing they were built to do.
The eleven deliberate stops are worth reading as a list, because they are the part of an automation nobody writes into a proposal: Held for revision. Not viable. Fallback returned. Cold pool. Exits, nothing changed. Stored, base unchanged. Rejected. Held on watchlist. Front-desk task. No-show risk flag. Back to the card.
Every one of those is a case where the correct behaviour is to not proceed. A system that lacks them does not become simpler. It becomes a system that does the wrong thing confidently when reality fails to match the brief.
The five self-maintenance endings are the other quiet category: vector stores being updated, score histories being appended, records retained for audit. Work the system does on itself so that it keeps working, which never appears in the pitch and always appears in the build.
Decisions are a small minority of the structure
If you read automation marketing, you would think the model making decisions is most of the product.
Across 139 nodes:
- 64 are plain actions (46%)
- 31 are terminals
- 21 are decisions (15%)
- 15 are intake
- 8 are orchestration
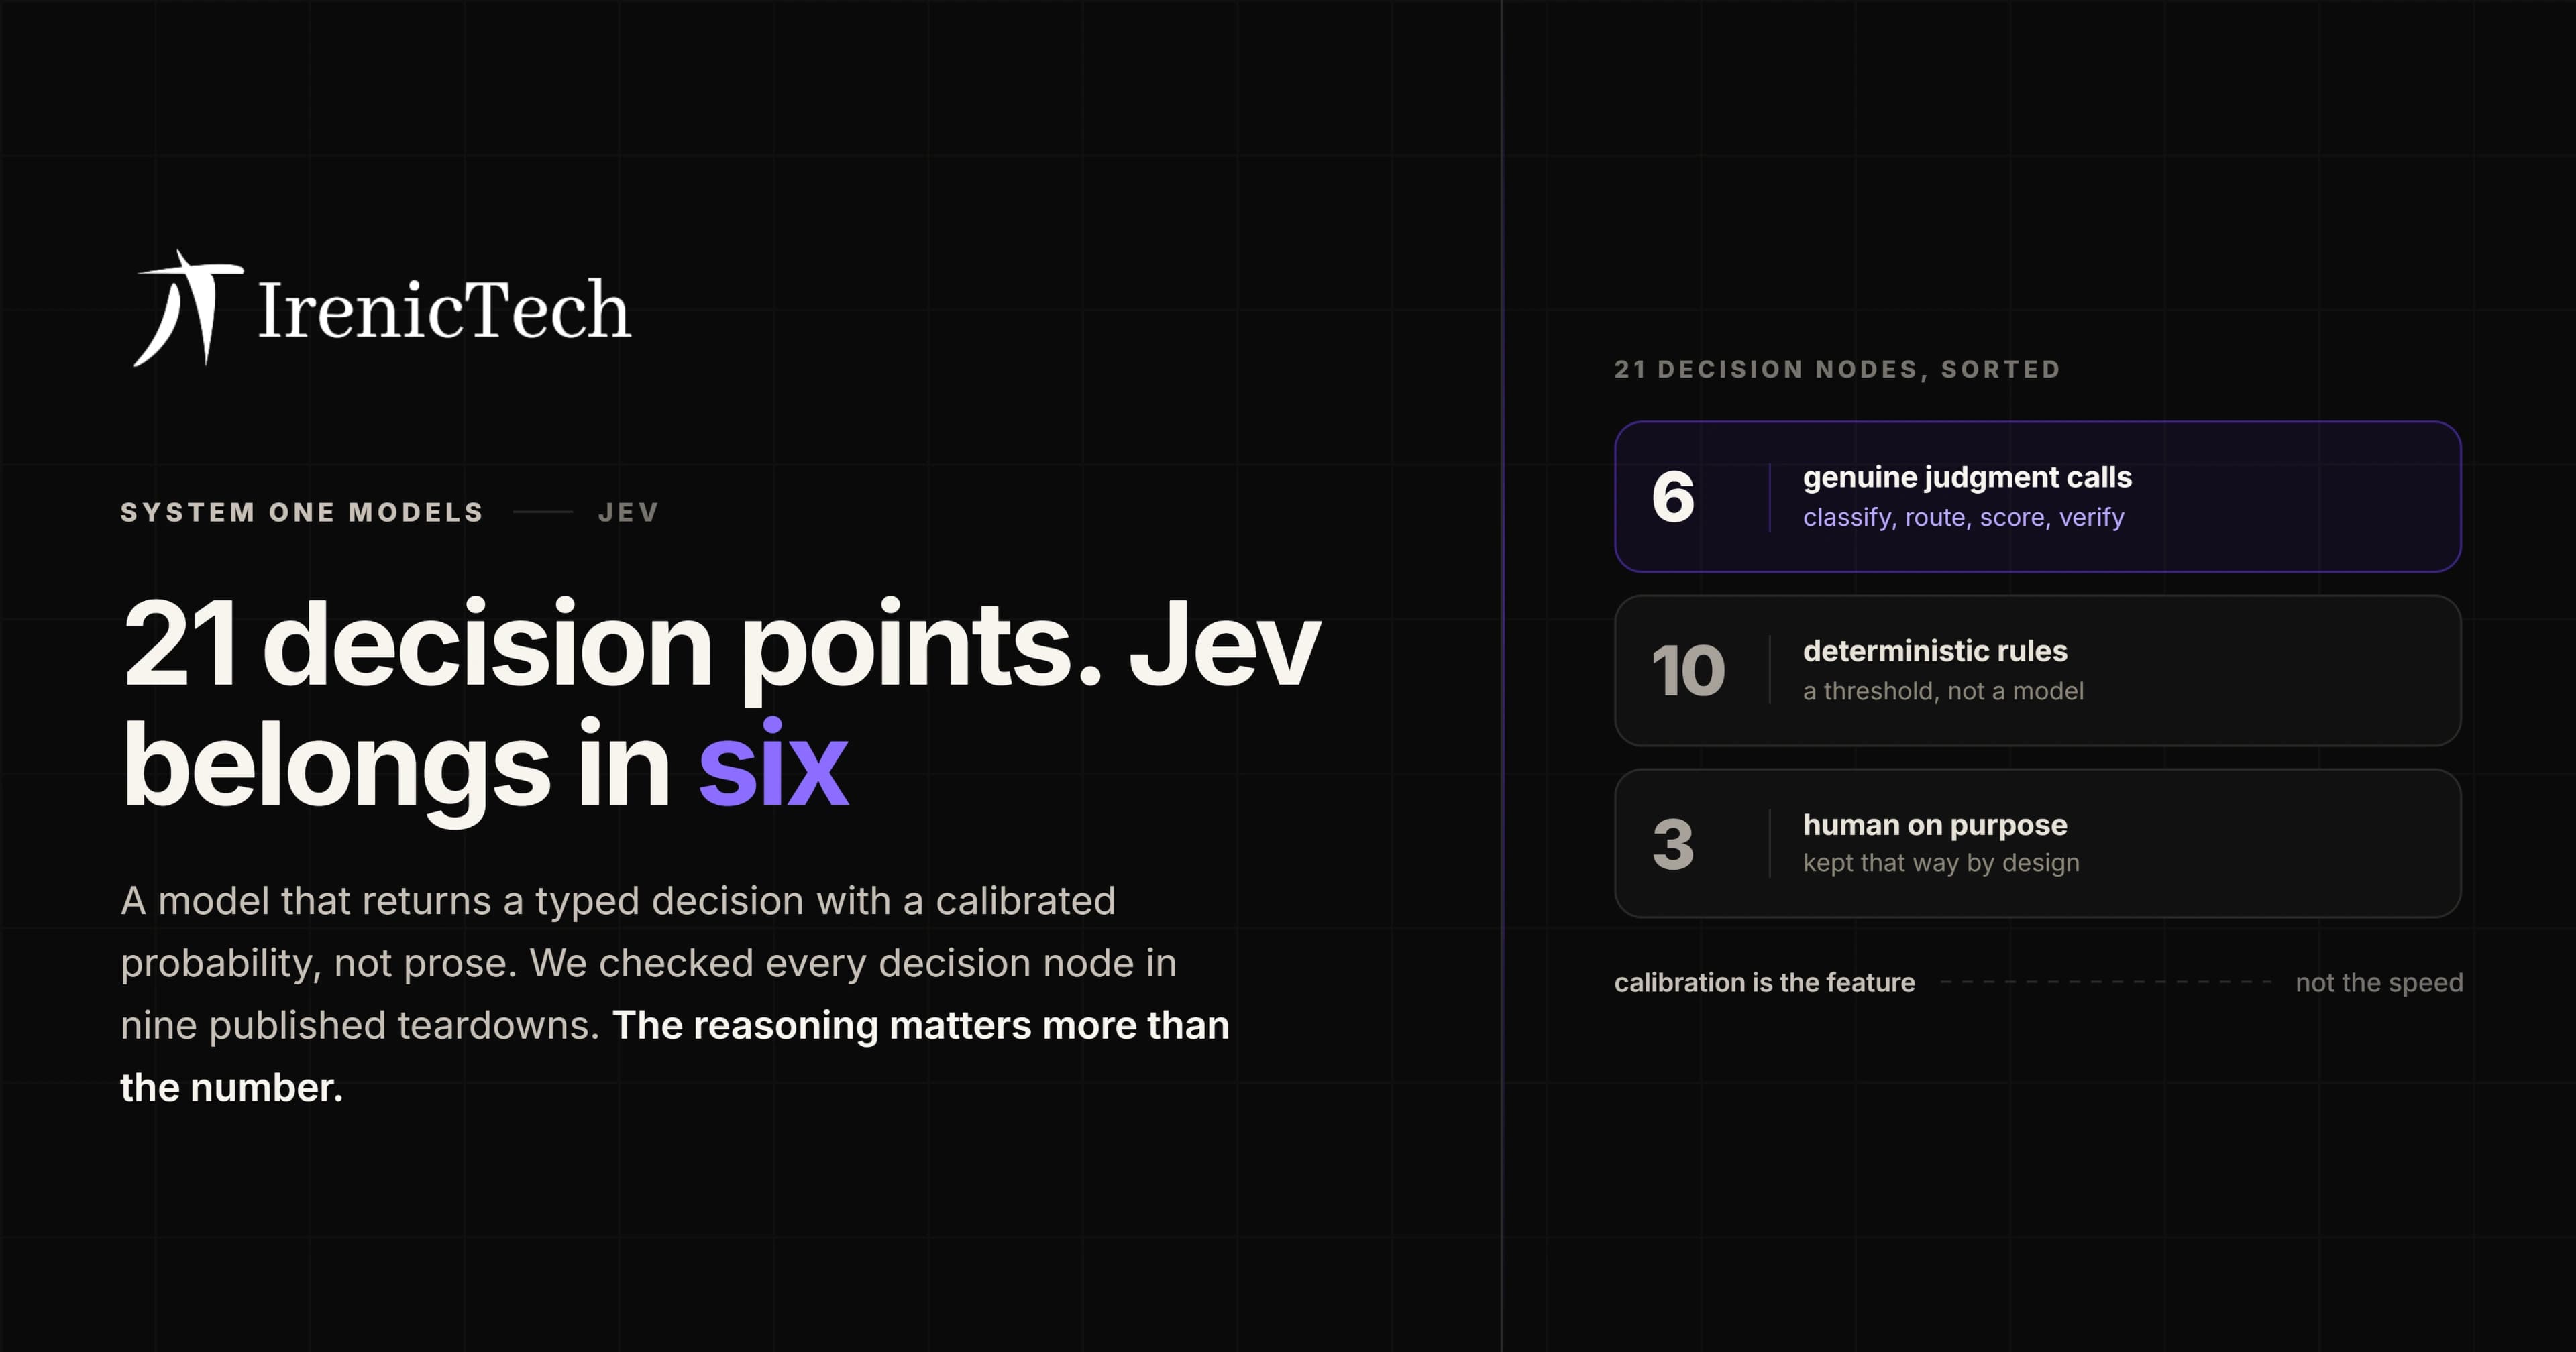
The decision layer is about a sixth of the graph. And when we went through those 21 decision points individually in an earlier analysis, ten turned out to be deterministic rules, three were human on purpose and one was retrieval. Six were genuine judgment calls, and the twenty-first depends on image handling we could not verify, so we left it uncounted.
That is not an argument against using models. It is an argument that the engineering around the model is most of the work, and that a budget which treats the model as the project is mis-shaped from the start. It is also the same conclusion we reached from the other direction in why most AI agents never reach production.
These are not trigger-and-action scripts
Median depth is 10 stages, with a range of 6 to 12. Node counts run from 8 to 21.
The depth does not come from the main path being long. It comes from the branches: the cases where a value is missing, a match is ambiguous, a document is unverifiable, or a person has to sign off. The happy path through most of these systems is short. The system is large because of everything else.
One spine and a very long tail
47 distinct tools appear across the nine systems, and 57% of them appear in exactly one node.
Meanwhile n8n alone accounts for 19% of all nodes, because it is doing the routing almost everywhere. Airtable is next at 12 nodes, then GoHighLevel at 11 and Zoho CRM at 8.
So the real shape is one orchestration spine plus a long tail of tools that each do exactly one thing: a registry lookup, a transcription, a vision check, a video render, a crawl.
That tail is an argument against consolidation. A platform that promises to replace all 47 is offering to replace the easy part, because the tail exists precisely because each of those tools is the best available answer to one narrow problem.
What we would change about how you scope one
Three things follow directly from the counts.
Budget for the endings. If roughly half of a delivered system is refusals, holds, escalations and self-maintenance, then a scope covering only the successful path covers less than half the build. The most productive early question is not what happens when it works. It is what should happen when the input is ambiguous, when a human has to approve, and when the right answer is to do nothing.
Do not model a rule. Ten of the 21 decision points in this corpus are thresholds, exact matches, status lookups and checksums. Those execute in under a millisecond, cost nothing and are auditable. Putting a model behind one makes it slower, dearer and less predictable.
Expect the tail. If a proposal names three tools, it is either a simpler problem than this corpus, or the tail has not been discovered yet. Usually the second.
What this is not
Worth being explicit about the limits, because research with no stated limits is marketing.
Nine systems is a small corpus. These are directional findings, not population statistics.
They are all ours. One studio, one set of habits, one way of drawing a graph. A different team would produce different node counts for the same work, and our classification of what counts as a decision or a terminal is a convention rather than a law.
They are not a random sample. They are the delivered systems whose workflow source was detailed enough to transcribe honestly. Two further delivered systems are deliberately absent because their source documents carry block diagrams rather than per-edge conditions, and inventing the decision logic to fill the gap would have made this corpus worse.
And the classification in the endings table involves judgment. You may think Retained for audit is a delivered outcome rather than self-maintenance. That is a reasonable disagreement, it moves the headline by a few percentage points, and you can check it yourself, which is the whole point of publishing the graphs.
Why we publish these at all
A screenshot proves nothing. Anyone can show a dashboard.
A branch table showing every condition that fires proves somebody thought about the cases, and it lets a prospective client check the thinking rather than take our word for it. It also produces the occasional uncomfortable finding, like discovering that the decision layer we sell is 15% of the structure, and publishing that anyway.
All nine teardowns are public, with no client names and no measured figures, because the decision logic is the part worth showing. If you want the same treatment applied to a workflow of yours, tell us what it has to handle and book a discovery call. Two platforms carry most of this work, so we describe them separately: our n8n automation agency page and our GoHighLevel developers page.
All figures computed on 23 September 2026 from the nine system graphs published at /services/ai-automation/systems. Node kinds, stage counts and edge conditions are taken from the same data that renders those pages, so the counts and the diagrams cannot drift apart.
Frequently asked
How many steps does a real business automation have?
In this corpus of nine delivered systems the median is 10 stages deep, with a range of 6 to 12, and between 8 and 21 discrete nodes per system. That is substantially more than the trigger-and-action model most automation marketing implies. The depth comes less from complexity in the main path than from the branches: handling the cases where something is missing, ambiguous, unverifiable or needs a person, which is where most of the structure actually lives.
What happens when an automation cannot complete its task?
In well-built systems it ends deliberately rather than failing. Across the nine systems we counted, 11 of 31 endings are the system stopping on purpose: holding an item for revision, routing to a human, marking an enquiry not viable, returning a fallback answer, parking a contact in a cold pool, or exiting having changed nothing. Designing those endings explicitly is what separates an automation you can trust from one that silently does the wrong thing when reality does not match the happy path.
How much of an AI automation is actually AI?
Less than the marketing suggests. In this corpus only 21 of 139 nodes are decision points at all, and by our earlier classification of those 21, roughly six are genuine judgment calls that a model is the right tool for. The rest of the graph is intake, orchestration, plain actions and terminals. That is not an argument against using models. It is an argument that the engineering around them is most of the work, and that the budget should reflect it.
What tools do production automations actually use?
One orchestration spine plus a long tail of single-purpose tools. Across nine systems we counted 47 distinct tools, and 57% of them appear in exactly one node. n8n alone accounts for 19% of all nodes because it is doing the routing in most of the systems. The practical implication is that a platform promising to replace all 47 is solving the easy part, since the tail exists precisely because each of those tools does one specific thing well.
Why do so few companies publish their automation architecture?
Usually because the decision logic is the deliverable, and publishing it feels like giving away the work. We take the opposite view: a screenshot proves nothing, whereas a branch table showing every condition that fires proves somebody thought about the cases. It also makes claims checkable. Every number in this analysis is computed from graphs that are published in full, so a reader who disagrees can go and recount them.
How should this change how I scope an automation project?
Budget for the endings, not just the path. If roughly half of what a delivered system does is decline, hold, escalate or maintain itself, then a scope that describes only the successful path is describing less than half the build. The most useful question early is not what happens when it works, but what should happen when the input is ambiguous, when a person needs to approve, and when the system should do nothing at all.
Read us on Google
Make IrenicTech a preferred source.
Tell Google you want our work first. It takes one tap, and IrenicTech is favoured in your Top Stories, AI Mode, and AI Overviews whenever you search the topics we write about.
Add to preferred sources